
Tracking Trends and Challenges in U.S. Containerized Trade
The Swing of the Pendulum | Rise of Consumer Imports | Hidden Costs of Return | Red Sea Diversions
By Jock O’Connell
The Swing of the Pendulum: U.S. West Coast Port Dynamics
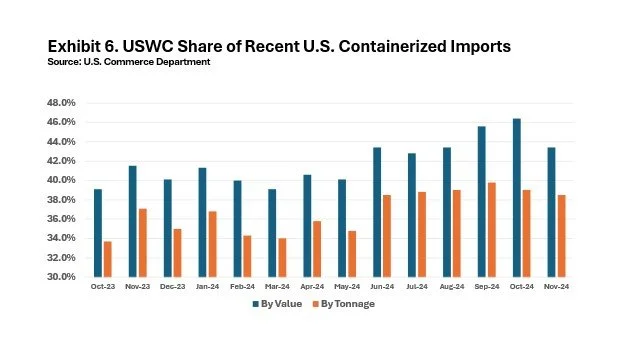
For those tracking the swing of containerized trade to U.S. West Coast (USWC) ports as shippers spent months coping with a possible strike or lockdown of ports on the East and Gulf Coasts, here are the latest monthly data from the U.S. Commerce Department. What Exhibit 6 shows is that the USWC share of containerized import tonnage crested in September at 39.8% and then declined over the next two months. The USWC ports’ share of the value of containerized imports peaked a month later at 46.4% in October.
The figures for December will become available on February 5. As a reminder, the tonnage and value numbers from the Commerce Department are derived from information supplied by shippers or their agents on official government import/export documents.
The Rise of Consumer Imports: A Broader Perspective

Contrary to the impression many may have, not all imported goods are intended for the consumer market. Factories import raw materials and machinery. Hospitals import diagnostic equipment. School districts import cleaning supplies and paper products. Businesses import office supplies. Airlines import planes and aviation gear.
The U.S. commerce Department usefully breaks down America’s import trade by end-user. As it turns out, Industrial Supplies constitute the largest category of imports. Still, imports of consumer items have been the fastest growing category of imports entering the United States. Exhibit 7 reveals the trend in inflation-adjusted dollars.
Was This Trip Really Necessary? The Hidden Cost of Returns

While on the subject of consumer imports, we take note of a new report in Supply Chain Dive that retailers last year lost an estimated $103 billion due to fraudulent returns and claims. According to Appriss Retail and Deloitte, the merchandise return rate from in-store sales was 8.7%. By contrast, the return rate for e-commerce transactions was 24.5%. Fraudulent returns represented about 15% of the projected $685 billion in total returns, which, in turn, accounted for 13% of overall retail sales, which reached $5.19 trillion for the year just ended.
Retailers are loathe to crack down too heavily on fraudulent or even excessive returns for fear of antagonizing customers. As a result, huge volumes of merchandise wind up being discarded in landfills or sent to incinerators. These costs are ultimately reflected in the price of goods.
This is not insignificant in an economy where prices continue to go up and where public policy debates center on voters’ perceptions of inflation. Rather than blaming supply chain congestion and delivery delays, consumers and policymakers might consider the extent to which fraudulent returns which avail themselves of lax return policies are contributing to the rising cost of goods.
Red Sea Diversions: Resilience of South Asian Trade

The blockade the Yemeni Houthis have effectively imposed on shipping through the Red Sea and Suez Canal has not much restrained the volume of containerized shipments to the U.S. from South Asia, particularly the nations of India, Pakistan, Bangladesh, and Sri Lanka. As Exhibit 8 reveals, containerized shipments from those countries to U.S. ports remained fairly steady even as the crisis unfolded in the fall of 2023. Indeed, tonnage in the last three months was up 4.0% over the same months in pre-crisis 2022.
However, anyone who expected that shipments to U.S. ports from South Asia would be redirected to transpacific routes would be disappointed. As Exhibit 9 shows, America’s Pacific Coast ports have not seen any lasting benefit from any diversions of containerized cargo from South Asia to the U.S. since Houthi attacks on Red Sea shipping began in the fall of 2023. To be sure, the USWC share of import tonnage from South Asia did initially rise, peaking last June at 16.4% before falling off to a 13.0% share in November, below the 14.2% share USWC ports held in November 2022.