Where Has the West Coast’s China Trade Gone?
By Jock O’Connell
At least for some of us, it does not seem all that long ago when America’s trade with China scarcely merited a line in official U.S. economic statistics. Diplomatic relations between Washington and Beijing were only restored in 1979 after decades of hostility. In the following year, when I first visited what was still very much Mao Zedong’s China, the country accounted for just 0.9% of our foreign trade. Of the 27 pages devoted to international trade in the 1980 Economic Report of the President, there was not a single reference to China.
Things began changing rapidly after China joined the World Trade Organization at the end of 2001. Trade (mostly Chinese exports, as it turned out) picked up dramatically. Just between 2003 and the eve of the Great Recession in 2007, containerized import tonnage from China swelled by 82.1% from 17,744,883 metric tons to 28,578,710 metric tons. In 2003, the Ports of Los Angeles and Long Beach handled 61.0% of that inbound traffic. The Port of Oakland and the Ports of Tacoma and Seattle handled another 4.2% and 10.5%, respectively.
Even before then, though, shipments of goods from China had started to migrate to other mainland U.S. ports. By 2010, as the U.S. economy was emerging from a steep downturn, the San Pedro Bay (SPB) ports’ share of containerized imports from China had declined to 50.7%, although the actual volumes of Chinese imports through those two ports grew by 6,545,925 metric tons or 36.9%. Oakland, Tacoma, and Seattle meanwhile saw their combined share of the nation’s Chinese imports shrink to 9.9%.
As Exhibit A demonstrates, the U.S. West Coast (USWC) containerized import trade with China has always been dominated by the Ports of Los Angeles and Long Beach. The volume of imported goods from China rose steadily from the end of the Great Recession until the imposition of higher tariffs under the first Trump administration. It subsequently saw a resurgence during the pandemic buying spree until falling off again last year.
Despite the decline in import tonnage through the San Pedro Bay ports, their share of the China import trade has been rising after dropping to 44.9% in 2022, as Exhibit B indicates. But the apparent gain in market share could easily be misunderstood. Indeed, what we have here is a teaching moment in interpreting statistical displays. The ostensible rise in the SPB ports’ market share from 2022 to 2023 shown in Exhibit B masks the fact that a broad fall-off in Chinese containerized imports into U.S. ports was felt less acutely at the two Southern California ports. Specifically, containerized import tonnage from China in 2023 was down 16.3% nationally, but by a smaller 13.8% at the San Pedro Bay ports. As a result, the San Pedro Bay ports’ share of the China import trade in 2023 was inflated to 46.2%, even though the two ports handled 4,044,102 fewer metric tons of containerized shipments from China.
Exhibit C offers a contrasting and certainly less flattering look at the containerized imports through the Ports of LA and Long Beach. In particular, it shows that, while import volumes during the first three quarters of this year were up over the same period last year, they remain below the volumes recorded in the same months of 2022. While the two ports are recently posting higher shares of the inbound China trade, these “gains” have come at a time of diminishing overall trade volumes. In particular, containerized imports from China might appear to be up in the first three quarters of this year over the same period last year, but they remain below the figures from the same period in 2022.
There is no question that the two Southern California ports have been losing major bits of the China trade to ports elsewhere in the U.S., but where exactly did the business go?
Let’s begin by contrasting the two Southern California ports with their most formidable rival, the Port of New York/New Jersey. As Exhibit D reveals, the East Coast megaport grew its share of containerized import tonnage from China from 9.1% twenty years ago to 12.5% last year and to 12.8% through September of this year. Over the same period, its share of the value of those imports rose from 6.9% to 10.8% both last year and so far this year. Importantly, though, PNYNJ’s value shares have consistently lagged its tonnage share, reflecting shippers’ preference for directing goods with lower value-to-weight rations to PNYNJ.
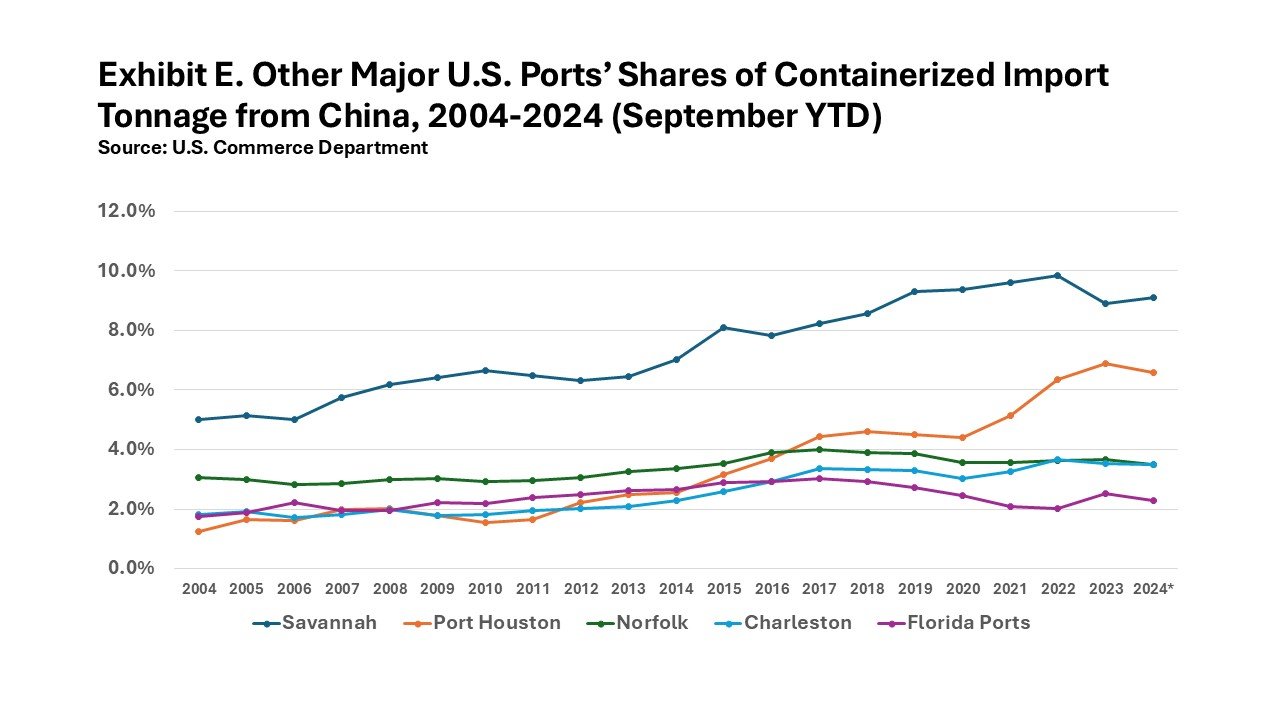
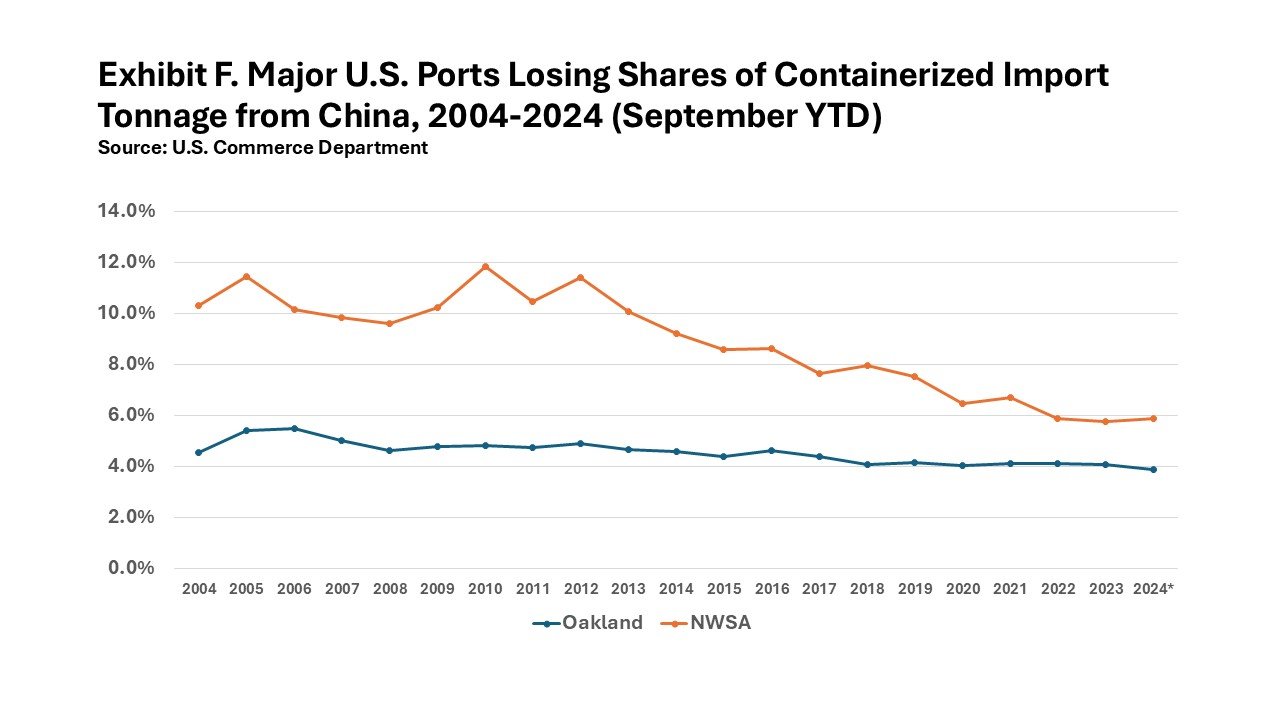
Which of the nation’s other major ports have seen increases in their shares of the nation’s containerized import tonnage from China? The answer to that question is displayed here in Exhibit E, while Exhibit F identifies the major ports that have lost market share.
Port Houston saw the largest weight share gain, rising from a 1.3% share in 2004 to a 6.9% share last year before slipping to a 6.6% share so far this year. Not surprisingly, the Texas port’s share of inbound containerized tonnage from China has more than doubled since the opening of the new set of locks at the Panama Canal in mid-2016.
Nevertheless, the Port of Savannah has continued to hold the highest share of the Chinese import trade among the nation’s second-tier ports, peaking at 9.9% in 2022 before receding to 9.1% this year. The Ports of Virginia and Charleston currently boast identical 3.5% shares. Florida’s ports have seen the smallest gains, increasing from 1.8% twenty years ago to a 2.3% share this year.
Exhibit F reveals the two ports that have not secured larger shares of America’s containerized import tonnage from China. Those are the Port of Oakland and the Northwest Seaport Alliance Ports of Tacoma and Seattle. The San Francisco Bay Area port’s share of Chinese containerized import tonnage has slipped from 4.5% in 2004 to 4.1% last year and to 3.9% so far this year. Meanwhile, the NWSA ports have endured a much more precipitous loss of share, falling from 10.3% to 5.8% last year before edging up to 5.9% through the first nine months of this year.
This is not to say that import volumes at the two Pacific Coast maritime gateways have declined uniformly. At Oakland, containerized import tonnage from China last year was actually 612,651 metric tons higher than it was in 2004, a gain of 38.0%. By contrast, however, the Ports of Tacoma and Seattle handled 526,368 fewer metric tons from China in 2023 than in 2004, a 14.3% drop.
Exhibit G displays the history of containerized import tonnage arriving from China at the major USWC ports. If nothing else, it demonstrates the consolidation of the West Coast’s China trade through the Southern California gateways.
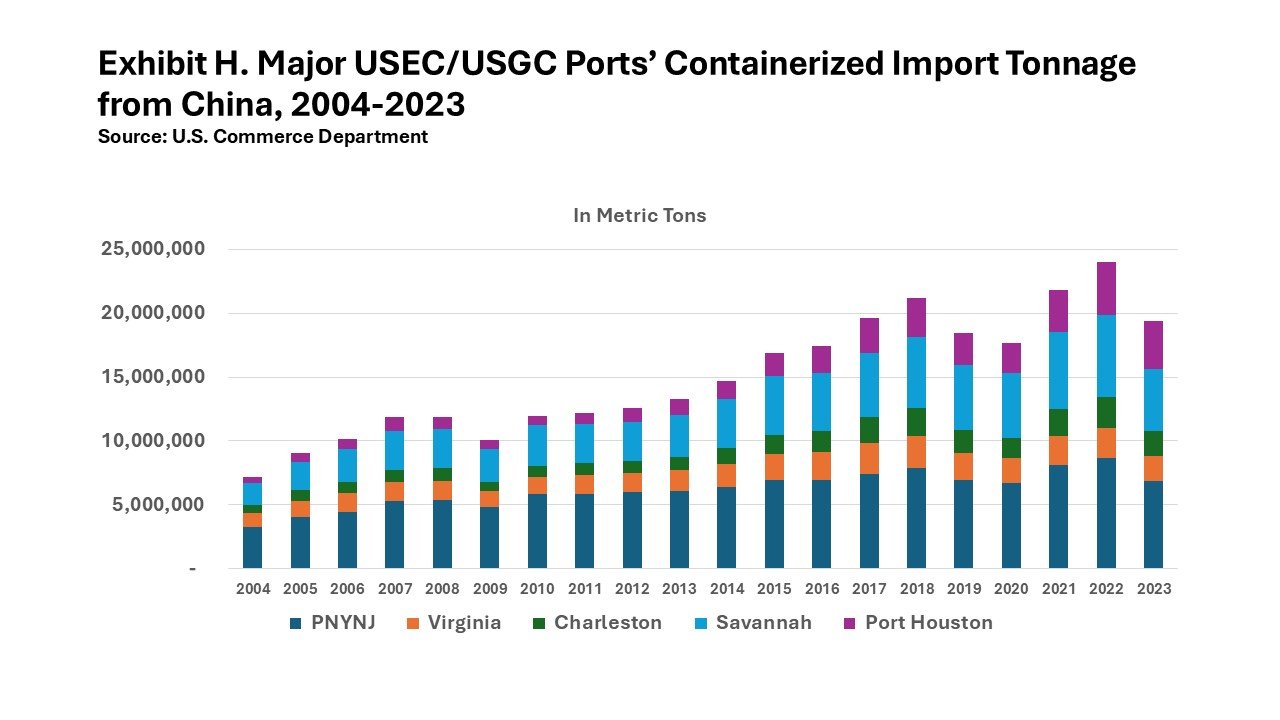
Exhibit H similarly displays the history of containerized imports arriving from China at the major East and Gulf Coast ports between 2004 and last year. If nothing else, it demonstrates the increased competitiveness of second-tier ports, especially Port Houston and Savannah.
What’s the future of the China trade? That will hugely depend on how the next administration reorders the nation’s trade policies.
No gift of inspired insight is needed to conclude that the prospects for expanded trade between the United States and China are bleak. As he demonstrated during his previous term in the White House, Donald Trump regards tariffs as a panacea for most economic woes. Throughout his re-election campaign, the now President-Elect promised to impose extraordinarily high tariffs on imported goods from China and may be similarly prompted to penalize products from Chinese-owned factories in Southeast Asia. Such a step would further diminish transpacific trade. If – or more likely when – maritime trade with China further declines, any resulting increase in West Coast ports’ market share should be viewed in context and not celebrated as a measure of increased competitiveness.
The commentary, views, and opinions expressed by Jock O’Connell are his own and do not reflect the views or positions of the Pacific Merchant Shipping Association. PMSA does not endorse, support, or make any representations regarding the content provided by any third party commentator.


