Flux in the Recyclable Export Trade
Jock O’Connell
For all the media attention lavished on containerized imports, especially now when shipping through both the Panama and Suez Canals is under stress, we don’t hear nearly as much about what – apart from air – is in the boxes that do sail from our shores. That leaves a lot of room for speculation about containerized exports.
In 2022, some 239,571,000 short tons of merchandise arrived in containers at U.S. ports. There were a lot of consumer products in these boxes as well as capital goods and industrial supplies. By contrast, containerized exports totaled 123,024,629 short tons in 2022. What was in those containers? Readers of my commentaries may recall a piece I wrote several months ago about how much of what we export in containers are items generated by farmyards and junkyards.
So, to start the year, I thought I would delve further, with some help by CalRecycle, the State of California’s waste disposal agency, into the solid waste materials U.S. West Coast ports ship abroad in containers.
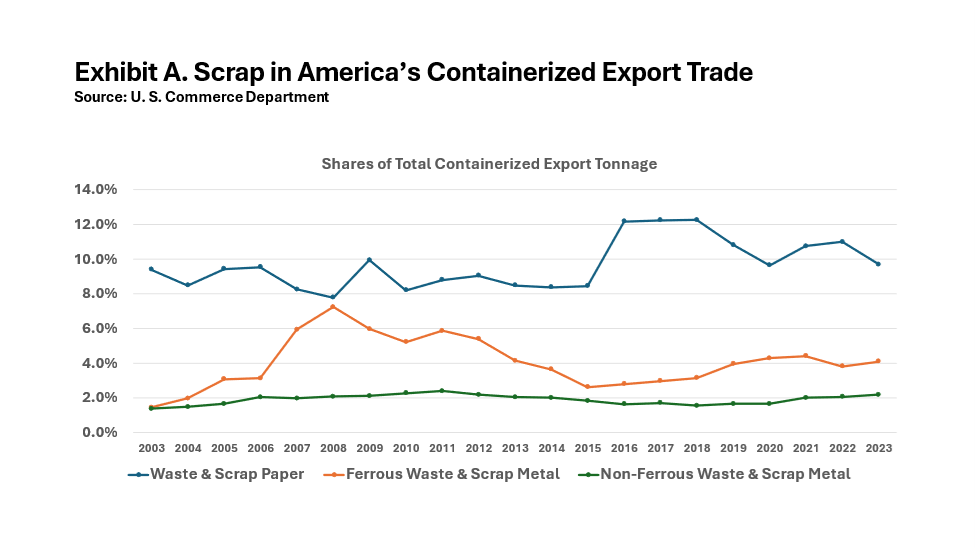
Nationally, waste and scrap materials account for about one-fifth of the containerized tonnage exported from U.S. seaports. The three most prominent categories of waste and scrap exports have been: Waste & Scrap Paper (HS Code 4707); Ferrous Metal Waste & Scrap (HS 7204); and Non-Ferrous Metal Waste & Scrap (chiefly HS 7602 and HS 7404). Together, their share of the country’s oceanborne containerized export trade over the past twenty years has ranged from 12.0% in 2004 to a high of 18.0% in 2009. Most recently, it hit 17.2% in 2021 before sliding to 16.0% in the just concluded year of 2023. The next largest category of exported scrap, Worn Clothing (HS 6309), generally accounts for a half percent of U.S. containerized export tonnage.
Until 2023, the nation’s leading export commodity by tonnage had been Waste & Scrap Paper. Owing to a 15.4% year-over-year fall-off in export tonnage last year when a 29.5% year-over-year surge in containerized export tonnage of Polymers of Ethylene (HS 3901), scrap paper ceded the top spot to the polymers but still accounted for a 9.7% share of all containerized export tonnage.
While U.S. West Coast (USWC) ports do handle a small portion of the nation’s polymer export trade (4.5% last year), Port Houston dominates the trade with a 70.9% share in 2023. That means that Waste & Scrap Paper continues to loom largest in the containerized exports of California.
Indeed, 14.7% of all containerized export tonnage in 2023 from the Ports of Los Angeles and Long Beach were Waste and Scrap Paper, while Ferrous Metal Waste & Scrap and Non-Ferrous Metal Waste & Scrap held 6.9% and 2.6% shares, respectively. Last year, some 63,335 short tons of Worn Clothing were also shipped from the San Pedro Bay ports, accounting for 0.3% of the ports’ containerized export tonnage year and down substantially from the 92,133 short tons of Worn Clothing shipped from the ports in pre-pandemic 2019. Waste Paring & Scrap of Plastics (HS 3915), which amounted to as high as 847,740 short tons in 2014 when it accounted for 3.0% of all contained tonnage leaving the two ports, totaled a mere 23,631 short tons of exports in 2022 and has fallen in the first eleven months of 2023 by 20.7% from the same period in 2022.
At the Port of Oakland, Waste & Scrap Paper continues to be the largest contributor to the port’s containerized export tonnage. In 2023, with a 25.3% share of all outbound tonnage, down slightly from 25.8% the year before, and from a peak of 27.0% in 2018. Ferrous Metal Waste & Scrap jumped to an 8.1% share last year from a 5.9% share in 2022. Non-Ferrous Metal Waste & Scrap shipments held a 2.8% share of Oakland’s export tonnage last year, a bit higher than its share in recent years. 19,461 short tons of Worn Clothing were also shipped from the East Bay port in 2023, well below the 29,060 tons exported in pre-pandemic 2019. Containerized exports of plastic waste, which supplied as much as 178,294 short tons of cargo in 2014, plummeted to 6,397 short tons in 2020 and declined by 34.15% through November of 2023.
Up in Washington State, at the Northwest Seaport Alliance Ports of Tacoma and Seattle, waste and scrap goods represent smaller shares of the containerized export trade. Waste & Scrap Paper last year accounted for a 4.8% share, down from 5.4% a year earlier, and from a high of 9.2% in 2017. Ferrous Waste a& Scrap tonnage plunger 64.3% in 2023, leaving it with a slender 0.8% share of the NWSA containerized export tonnage, down from 2.2% the preceding year. Shipments of Non-Ferous Waste & Scrap held steady with a 2.2% share of the NWSA’s containerized export tonnage both this year and in 2022. Exports of Worn Clothing (23,425 short tons) constituted just 0.4% of last year’s outbound box trade tonnage. The peak for Worn Clothing exports from the NWSA ports was 41,939 short tons in 2018. Plastic waste, which yielded 118,901 short tons of containerized exports at the NWSA ports in 2016, last year produced just 1,797 short tons.
Of the three West Coast states, California keeps the sharpest eye on its foreign shipments of recyclable goods. The California Department of Resources Recycling and Recovery (CalRecycle) publishes an annual “State of Disposal and Recycling Report”. The latest issue was released in December 2022 and features statistics from 2021. The trade data collected by similar agencies in Oregon and Washington State include shipments of waste to other states in their definitions of exports.
As the following exhibits indicate, it has been a volatile trade driven on the supply side by the unrivaled American propensity for generating waste and resisted by a spreading unwillingness of other countries to accept the waste products we’ve been stuffing in containers. As a result, volumes of exports are likely to diminish even as destinations shift to markets less squeamish about the contents of the containers they unpack. As we shall see below, plastic scraps used to be big but are now no longer in high demand abroad.
CalRecycle estimates that California’s 39.3 million residents and 1.7 million businesses generated about 76.7 million short tons in 2021. Of that total waste generation, 46 million short tons went to domestic disposal and disposal-related activities, including about 41.5 million short tons sent to landfills. This equates to a statewide per capita disposal rate of 6.4 pounds per person per day. Of the total amount disposed, over 920,000 short tons was debris from disaster areas, up from 160,000 short tons in 2020.
In addition to the about 54% of total materials that were sent to landfills, around 16% were exported as recyclables, an estimated 12% were composted, anaerobically digested, or mulched, and another 12% were locally recycled, or source reduced. The remainder of the material, less than 6%, went to alternative daily cover (ADC), beneficial reuse, transformation, alternative intermediate cover (AIC), waste-tire derived fuel, and engineered municipal solid waste (EMSW).
Perhaps surprisingly, the commercial sector was the source of 48% of disposed material, followed by residential (32%), and then “self-haul” sources (20%). Compared to 2020, disposal decreased in both the commercial and residential sectors. Recent increases in the incidence of wildfires and severe weather conditions have generated a surge in what CalRecycle terms “Disaster Debris”. Based on data CalRecycle has collected through the Recycling and Disposal Reporting System (RDRS), the total amount of disaster debris, including structural debris and hazard trees, disposed of in California totaled over 900,000 tons in 2021, up from less than 200,000 tons in 2020
CalRecycle estimates that oceanborne export of recyclable materials accounted for about 12.2 million short tons in 2021, a decrease of approximately 1 million short tons from 2020. Despite the decline, seaborne exports of recyclable materials remained the largest destination for statewide recycling. CalRecycle also has begun estimating the amount of scrap plastics exported via truck and rail to Mexico and Canada, with Mexico in 2021 the largest importer of scrap plastics from California, receiving more than 43,000 short tons via truck and rail.
Based on the 2021 data, 12.2 million short tons of recyclable materials were exported from California ports to international markets. Compared to 2020, the tonnage decreased by 9% in 2021 by over one million short tons. Recyclable materials exported from California ports had a vessel value of about $5.9 billion. So, despite the reduction in tonnage exported, the total vessel value increased by about $1.4 billion compared to 2020.
The three countries importing the most recyclable materials from California in 2021 were, in order of greatest tonnage: Taiwan, Vietnam, and Thailand. From 2000 to 2020, China had been the largest importer of California’s recyclable materials. But, in 2021, China fell to seventh place among the largest importers. The volume of recyclable materials imported by China has been steadily decreasing since 2011, when China imported about 5% of all seaborne recyclable materials by weight and 15% by vessel value.
CalRecycle devised its own classifications of recyclable materials. The five recyclable material categories with the most weight exported from California in 2021 were OCC (Old Cardboard Containers) and Kraft Paper; Ferrous Metal; Non-Ferrous Metal; Unsorted Mixed Paper; and Other Miscellaneous Paper. The five most valuable exported recyclable material types by vessel value were: Non-Ferrous Metal; Ferrous Metal; OCC and Kraft Paper; Worn Clothing; and Other Miscellaneous Paper. (Kraft paper, by the way, is paper or paperboard, usually light brown in color, that is widely used in packaging.)
International trade and environmental policies influence where waste materials are sent. As countries adopt new policies and restrictions, the movement of California’s recyclable materials may shift. Exports of recyclable materials to China have been decreasing for the past decade, largely as a result of China’s Green Fence and National Sword policies. In 2021—for the first time in many years—China was not one of the top five countries importing recyclable materials from California. In contrast to the more than 13 million tons of recyclable material imported by China in 2011, China imported less than one million tons in 2021, according to CalRecycle.
The issue of contamination and import restrictions are especially important for plastics and plastic contamination, causing significant decreases in the amount of plastic scrap exported by California. In 2021, California exported less than 100,000 short tons of plastic scrap, compared to almost 1.3 million tons in 2014. That volume has continued to fall. Exhibit B dramatizes the path that containerized exports of plastic waste materials have taken over the past two decades. Especially noteworthy is the 87.9% plunge in the overseas trade from its peak of 1,822,671 short tons in 2016 to just 220,903 short tons in 2022. Through the first eleven months of 2023, the trade slipped a further 14.0% from the same months in 2022.
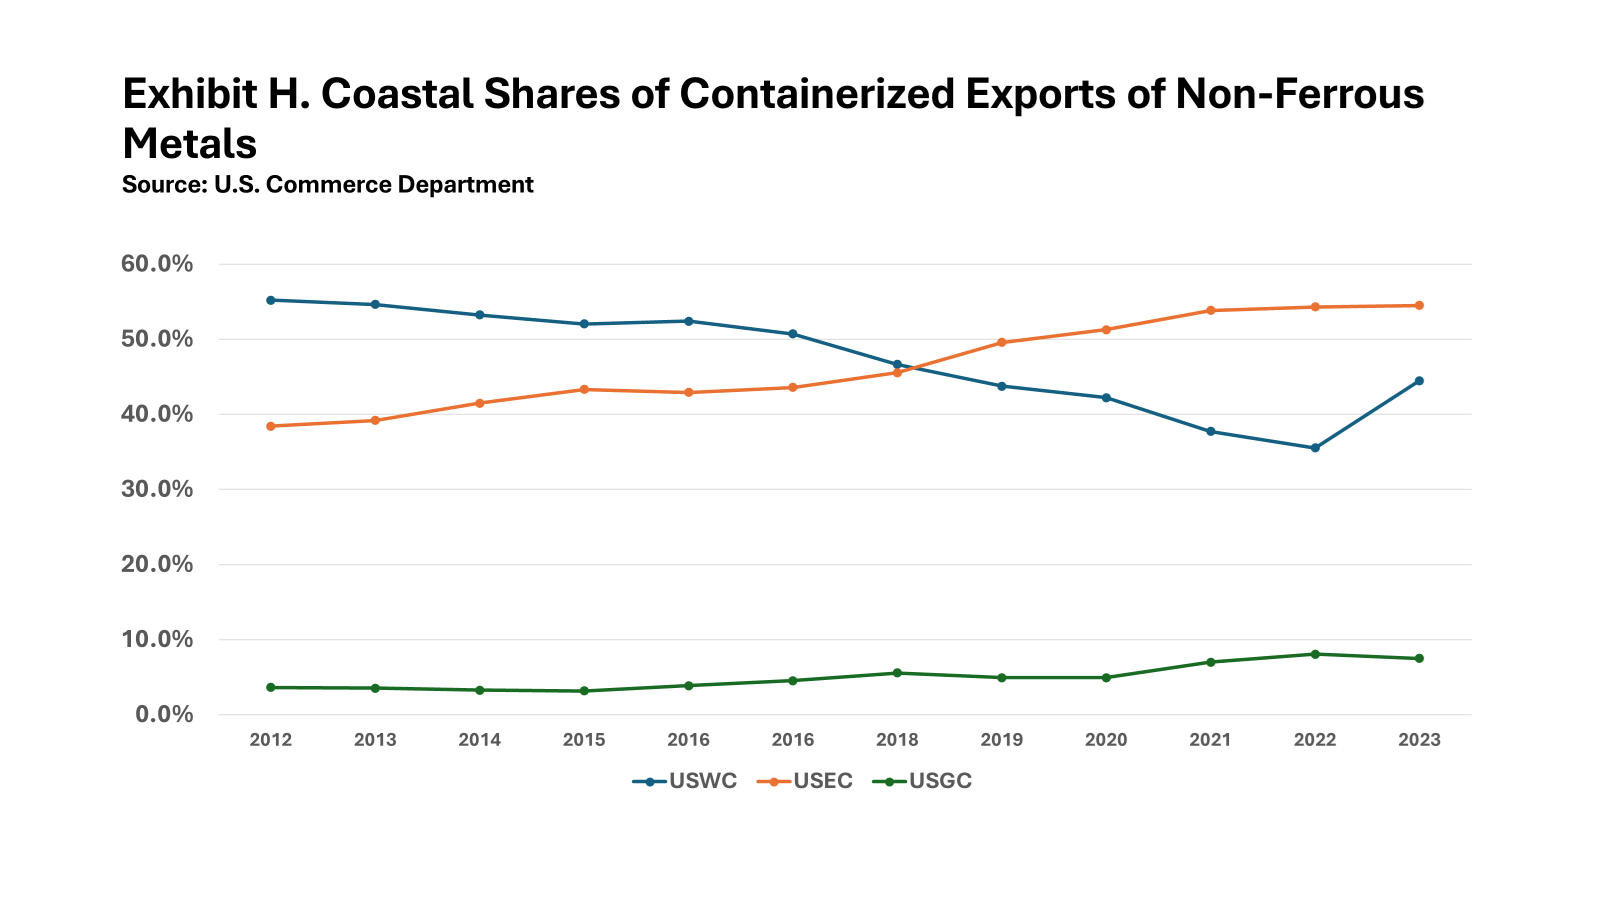
The following charts, Exhibits C-K, are based on official export statistics collected by the Foreign Trade Division of the U.S. Census Bureau in the U.S. Department of Commerce and are intended to illustrate how USWC ports have been faring with containerized exports of waste & scrap materials. Because of classification distinctions, these charts may not match those used in reports from CalRecycle, although the source of the data remains the same.